

Producer Price Indexes increased slightly in January 2018
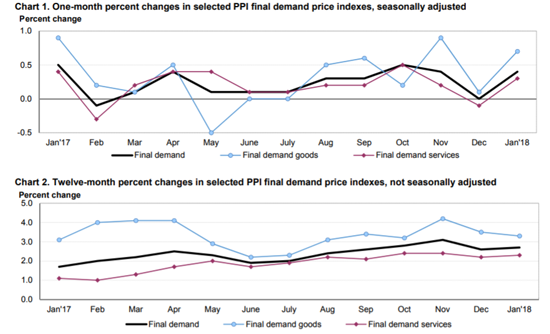
The Producer Price Index for final demand increased 0.4 percent in January, seasonally adjusted, the U.S. Bureau of Labor Statistics reported February 15.
Final demand prices were unchanged in December and moved up 0.4 percent in November. On an unadjusted basis, the final demand index rose 2.7 percent for the 12 months ended in January.
In January, the rise in the index for final demand is attributable to a 0.3-percent increase in prices for final demand services and a 0.7-percent advance in the index for final demand goods.
The index for final demand less foods, energy, and trade services rose 0.4 percent in January, the largest advance since increasing 0.5 percent in April 2017. For the 12 months ended in January, prices for final demand less foods, energy, and trade services moved up 2.5 percent, the largest rise since 12-month percent change data were available in August 2014.
 |
Final demand
Final demand services: Prices for final demand services advanced 0.3 percent in January following a 0.1- percent decline a month earlier. Nearly two-thirds of the broad-based increase is attributable to the index for final demand services less trade, transportation, and warehousing, which moved up 0.4 percent. Margins for final demand trade services rose 0.3 percent, and prices for final demand transportation and warehousing services advanced 0.4 percent. (Trade indexes measure changes in margins received by wholesalers and retailers.)
Product detail: A major factor in the January increase in prices for final demand services was the index for hospital outpatient care, which rose 1.0 percent. The indexes for apparel, footwear, and accessories retailing; health, beauty, and optical goods retailing; residential real estate services (partial); long-distance motor carrying; and hospital inpatient care also moved higher.
In contrast, margins for chemicals and allied products wholesaling declined 2.3 percent. Prices for wireless telecommunication services and airline passenger services also fell.
Final demand goods:
The index for final demand goods jumped 0.7 percent in January, the sixth consecutive increase. Over 80 percent of the January advance can be traced to prices for final demand energy, which climbed 3.4 percent. The index for final demand goods less foods and energy rose 0.2 percent. Conversely, prices for final demand foods fell 0.2 percent.
Product detail: Nearly half of the January increase in the index for final demand goods is attributable to prices for gasoline, which climbed 7.1 percent. The indexes for residential electric power, iron and steel scrap, diesel fuel, jet fuel, and fresh and dry vegetables also moved higher. In contrast, prices for chicken eggs fell 38.9 percent. The indexes for residential natural gas and for power cranes, draglines, and shovels also declined.
Intermediate demand by commodity type
Within intermediate demand in January, prices for processed goods increased 0.7 percent, the index for unprocessed goods advanced 0.9 percent, and prices for services edged up 0.1 percent.
Processed goods for intermediate demand: The index for processed goods for intermediate demand climbed 0.7 percent in January, the sixth straight rise. Seventy percent of the January advance is attributable to a 2.5-percent increase in prices for processed energy goods. The index for processed materials less foods and energy also moved higher, rising 0.3 percent. Conversely, prices for processed foods and feeds moved down 0.3 percent. For the 12 months ended in January, the index for processed goods for intermediate demand advanced 4.6 percent.
Product detail: A major factor in the January increase in prices for processed goods for intermediate demand was the index for diesel fuel, which rose 5.1 percent. Prices for gasoline, commercial electric power, jet fuel, primary nonferrous metals, and copper and brass mill shapes also moved higher. In contrast, the processed eggs index fell 13.2 percent. Prices for utility natural gas and ethanol also declined.
Unprocessed goods for intermediate demand: The index for unprocessed goods for intermediate demand increased 0.9 percent in January, the third straight advance. Most of the January rise can be attributed to the index for unprocessed nonfood materials less energy, which climbed 3.8 percent. The index for unprocessed energy materials advanced 0.5 percent. Conversely, prices for unprocessed foodstuffs and feedstuffs declined 0.8 percent. For the 12 months ended in January, the index for unprocessed goods for intermediate demand climbed 2.5 percent.
Product detail: A major factor in the January increase in the index for unprocessed goods for intermediate demand was prices for iron and steel scrap, which jumped 12.9 percent. The indexes for crude petroleum, slaughter barrows and gilts, slaughter chickens, corn, and nonferrous scrap also moved higher. In contrast, prices for slaughter cattle fell 4.9 percent. The indexes for natural gas and wastepaper also moved lower.
Services for intermediate demand: Prices for services for intermediate demand inched up 0.1 percent in January following no change in December. Leading the increase, the index for services less trade, transportation, and warehousing for intermediate demand advanced 0.1 percent. Prices for transportation and warehousing services for intermediate demand rose 0.3 percent. Conversely, margins for trade services for intermediate demand declined 0.3 percent. For the 12 months ended in January, the index for services for intermediate demand climbed 2.9 percent.
Product detail: A 2.7-percent increase in the index for business loans (partial) was a leading factor in the January rise in prices for services for intermediate demand. The indexes for securities brokerage, dealing, investment advice and related services; network compensation from broadcast and cable television; paper and plastics products wholesaling; and long-distance motor carrying also moved higher. In contrast, margins for chemicals and allied products wholesaling fell 2.3 percent. The indexes for machinery and equipment parts and supplies wholesaling, internet advertising (sold by non-print publishers), and airline passenger services also decreased.
Intermediate Demand by Production Flow
Stage 4 intermediate demand: Prices for stage 4 intermediate demand advanced 0.3 percent in January after no change in December. In January, the index for total goods inputs to stage 4 intermediate demand climbed 0.7 percent, while prices for total services inputs were unchanged. Increases in the indexes for diesel fuel, gasoline, commercial electric power, business loans (partial), legal services, and paper and plastics products wholesaling outweighed declines in the indexes for machinery and equipment parts and supplies wholesaling, chemicals and allied products wholesaling, and prepared poultry. For the 12 months ended in January, prices for stage 4 intermediate demand moved up 3.1 percent.
Stage 3 intermediate demand: The index for stage 3 intermediate demand rose 0.4 percent in January, the sixth straight advance. In January, prices for total goods inputs to stage 3 intermediate demand increased 0.8 percent. The index for total services inputs was unchanged. Higher prices for gasoline, jet fuel, slaughter barrows and gilts, slaughter chickens, diesel fuel, and business loans (partial) outweighed decreases in the indexes for raw milk, slaughter cattle, and chemicals and allied products wholesaling. For the 12 months ended in January, prices for stage 3 intermediate demand climbed 4.1 percent.
Stage 2 intermediate demand: The index for stage 2 intermediate demand increased 0.5 percent in January, the seventh consecutive rise. In January, prices for total goods inputs to stage 2 intermediate demand moved up 0.5 percent, and the index for total services inputs advanced 0.3 percent. Higher prices for crude petroleum; network compensation from broadcast and cable television; legal services; securities brokerage, dealing, investment advice, and related services; commissions from sales of insurance; and liquefied petroleum gas outweighed declines in the indexes for natural gas, thermoplastic resins and plastics materials, and cable network advertising time sales. For the 12 months ended in January, prices for stage 2 intermediate demand rose 3.0 percent.
Stage 1 intermediate demand: Prices for stage 1 intermediate demand advanced 0.9 percent in January, the eighth straight increase. In January, the index for total goods inputs to stage 1 intermediate demand jumped 1.7 percent. In contrast, prices for total services inputs fell 0.2 percent. Rising prices for iron and steel scrap, diesel fuel, business loans (partial), gasoline, nonferrous scrap, and crude petroleum outweighed declines in the indexes for deposit services (partial), primary basic organic chemicals, and natural gas. For the 12 months ended in January, prices for stage 1 intermediate demand moved up 5.6 percent.
Click here to read the complete report.
PRO CONTRACTOR RENTALS MAGAZINE


Pro Contractor Rentals provides information of value to rental centers who focus time, resources and attention on meeting the demands of construction contractors and other equipment rental customers.